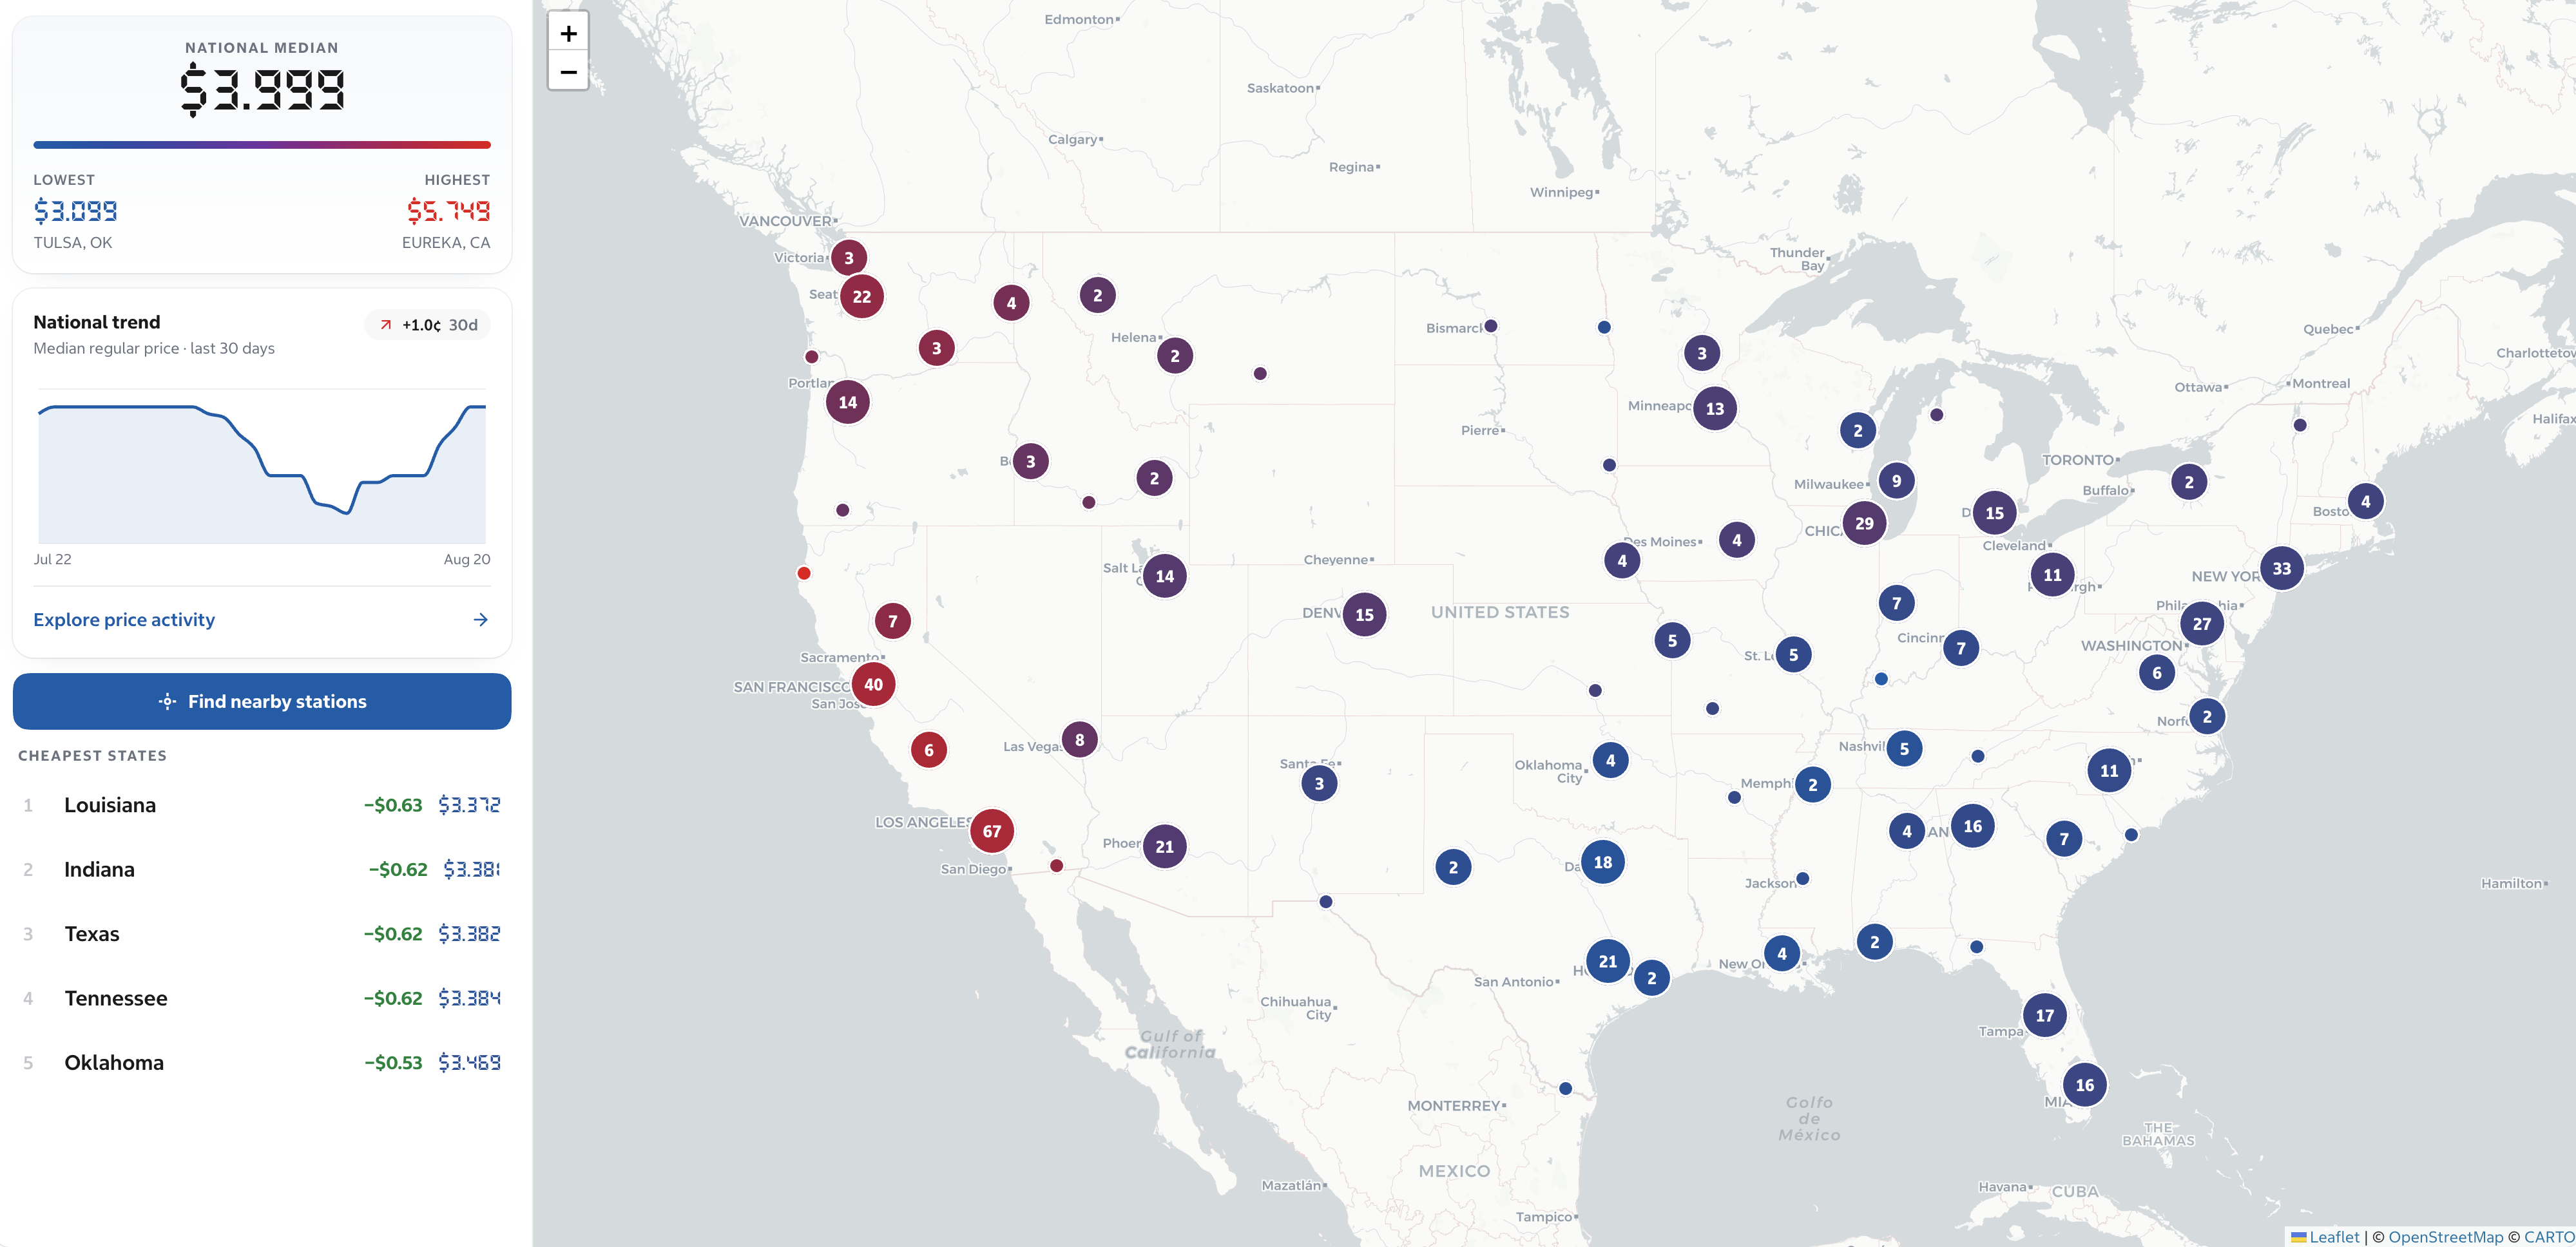
TL;DR: I tracked gas prices at 600 Costco warehouses during the Strait of Hormuz fuel crisis and mapped out how they changed.
Back in April, I lived almost exactly between two Costco warehouses, and for years I ran the same mental math every time I needed gas: which of the two was actually cheaper that week.
Unfortunately, Costco doesn't publish gas prices anywhere centrally. The official site buries them on individual warehouse pages, and my two nearest warehouses were rarely priced the same. Costco gas is famously a loss leader, typically running 15 to 20 cents below surrounding stations. That gap is usually enough to make the detour worth it, though not enough to make the choice between my two Costcos obvious.
As a commuter in Tampa, a sprawling city with almost no public transportation, I got a lot more conscious of where I filled up as gas prices climbed that spring. I started getting curious about Costco's prices specifically: were they climbing at the same rate as other gas stations, and could Costco realistically keep running gas as a loss leader if prices kept rising?
There was no good way to see that trend historically. So naturally, I built one.
Guzzling the Gas Data
Unfortunately, this was probably the easiest part of the project. I wish I had a cool reversing method to talk about like the Waffle House story, but Costco gave me very little resistance in collecting this data.
My first find when I started digging through Costco's site was AjaxGetGasPricesService, an endpoint that takes an input of warehouse IDs formatted as ID1_ID2_ID3_ID4. Underscores as an array delimiter is an interesting choice! It was useful, but not quite what I wanted; I needed the location data for each warehouse so I could map them out and figure out which was actually shorter to drive to.
Digging a little further surfaced exactly what I needed: AjaxWarehouseBrowseLookupView. Much like the name suggests, the function looks up warehouses using a latitude and longitude parameter input. Even better, the parameter populateWarehouseDetails stuffs the response with just about every piece of information you could want about a Costco: address, hours, services, food court availability (!!), and most importantly, gas prices.
GET /AjaxWarehouseBrowseLookupView
  ?latitude=27.95
  &longitude=-82.45
  &hasGas=true
  &populateWarehouseDetails=true
  &countryCode=US
The only catch with populateWarehouseDetails is the response body is massive. As much as I'd like to get every single Costco in the United States all at once, their API caps results at 50 warehouses per call and returns them sorted by distance from the lat/long you provide. To get national coverage, I needed to sweep the map.
Prices Are Sweeping the Country!
The approach was simple enough: lay out a grid of coordinates across the country, sweep each point, and deduplicate the warehouse IDs that come back. With ~600 Costco locations and 50 per response, a 3-degree grid across the continental US plus a few hand-picked points for Alaska and Hawaii gives more than enough overlap to catch every warehouse.
def grid_points(step: int = 3) -> list[tuple[float, float]]:
    points = []
    for lat in range(25, 50, step):
        for lng in range(-125, -65, step):
            points.append((float(lat), float(lng)))
    points.extend([
        (61.2, -149.9),  # Anchorage
        (64.8, -147.7),  # Fairbanks
        (21.3, -157.8),  # Honolulu
        (20.9, -156.5),  # Kahului
    ])
    return points
I capped how many requests could run at once so I wasn't hammering their servers all at once, and added automatic retries for the rare request that failed.
async def fetch_all_costcos() -> list[CostcoStation]:
    points = grid_points()
    seen: dict[int, CostcoStation] = {}
    semaphore = asyncio.Semaphore(CONCURRENCY)

    async with httpx.AsyncClient(headers=HEADERS, timeout=30) as client:
        tasks = [fetch_point(client, lat, lng, semaphore, ts)
                 for lat, lng in points]
        results = await asyncio.gather(*tasks)

    for result in results:
        for station in result:
            seen.setdefault(station.id, station)

    return list(seen.values())
The whole sweep takes just under 60 seconds and gets me every Costco gas station in the US with current prices, addresses, and coordinates in one shot!
Parking the Data Somewhere
Once I had the sweep working, I needed somewhere to put the data. Since the whole point was to watch prices move over time, this was fundamentally a time-series problem: the same ~600 warehouses, sampled over and over, forever, with every past reading kept so I could look back and see how each one changed.
Thankfully, TimescaleDB was the perfect shoe-in for this. It's an extension on top of Postgres, so I got the query language and tooling I already knew, but with time-series features layered on top. It's also free and quick to stand up (Thank you TigerData!), which is about all I ask from infrastructure on a project like this.
Once I had a place to put the data, I needed somewhere to show it off. Nothing fancy: one quick Next.js app, some Tailwind so it didn't look like a spreadsheet, a mildly frustrating afternoon fighting Cloudflare to get the Workers deployment behaving, and you have a live, searchable database of Costco gas prices.
But it's no fun to build something I can't share with others. Once I had something I was proud of, I set up a page for every station I track and let search engines index all of them, so the next time someone's standing in a Costco parking lot wondering which warehouse to drive to, they can just look it up instead of reverse-engineering an API like I did.
So... Is Gas Getting Cheaper or Not?
I started this project not long after the Strait of Hormuz scare had oil markets on edge. It's such a narrow chokepoint for the world's oil tankers that even the threat of it closing is enough to send gas prices skyrocketing.
Sure, I wanted the data for myself, but yet again there was a voice in my head that wanted to find the answer for more than just my own pocket.
Across the 172This is live data! days I've been tracking, Costco made 42,866 individual price moves, averaging 249 a day across ~600 warehouses. Net, cuts won out: 21,907 cuts against 20,959 hikes, a balance of about 948 more cuts than hikes.
Daily price moves
June
$4.06
July
$4.04
-$0.02 vs prior month
August
$4.15
+$0.11 vs prior month
September (so far)
$4.31
+$0.16 vs prior month
Cheapest states
- IN$3.43
- OK$3.57
- TX$3.63
- MS$3.66
- WI$3.67
Priciest states
- CA$5.64
- WA$5.21
- OR$4.86
- NV$4.82
- ID$4.61
So, what did I actually learn? Even the mighty Costco isn't immune to the whims of the Strait of Hormuz. A company that treats gas as a rounding error still has to move with the market… eventually.
I responded to this revelation like any rational person - after months spent perfecting a system to shave a few cents off a tank of gas, I traded in my CRV for a Tesla Model Y and now pay more in car payments every month than I could ever have saved chasing 15-cent gaps between two warehouses. At the exact moment I finally had the infrastructure to answer "which Costco should I drive to," I made the question permanently irrelevant for myself, personally, forever.
If the license plate looks familiar (or doesn't), you should go read my other post about how I snagged one of the nicest two-letter combinations in the state of Florida.
Especially thanks to Kai, Neesh, Ari, Landon, Mark, and Jaden for proofreading, and to the rest of Creamcheese Babgel. <3

Update (August 25th): After this post started making the rounds on Hacker News (hello if you're coming from there!), I was able to figure out how to track Costco gas prices outside the US too, including Canada, Mexico, Australia, Japan, the United Kingdom, and Taiwan - all are now supported for gas tracking! Unfortunately the data only starts from when I started polling, but hopefully it'll soon be useful for comparing prices across countries.